

Jarvis® Newsletter: Are “Safe” Investments Really Safe?

A Quick Note: Left Brain manages client funds based on their own research. We build client custom client portfolios by selecting securities from our five curated model portfolios of both bonds and stocks. We are now making these model portfolios available to public subscribers. To inquire about purchasing access to these model portfolios, which we update quarterly, click the button below to email our Director of Research, Brian Dress.
Happy New Year to you and your family from your friends at Left Brain!
Last year, our CEO Noland Langford declared 2024 the “Year of Income”. We are going to plant our flag once again and for our business, clients, and friends, once again declare 2025 the “Year of Income”
It’s been some time since we published in this space for you, the reader. We wanted to kick off 2025 with a letter that covers a topic we’ve been discussing both internally and externally for some time now – income investing. Namely, what is the best way for investors to secure passive streams of income in their portfolios.
There is a conventional wisdom in this business that governs income investing, answering two key questions: (1) how much of a client’s portfolio should be devoted to income securities? and (2) what types of income securities should an investor own?
With respect to “how much?”, we usually hear some heuristic or rule of thumb that says something like “The percentage of your portfolio allocated to bonds should be ‘100 minus your current age’” with no attention paid to a given client’s risk tolerance, objectives, time horizon, or anything else along those lines. We happen to think a blanket statement like this, which considers no context of the individual investor, is woefully inadequate to answer this very important question that comes up often for investors in or approaching retirement. It is for this reason that we have committed as an organization to build customized portfolios for each of our clients.
We are disturbed enough by the cookie cutter answer our industry provides to the important question of “how much fixed income should you own in your portfolio?” What we find even more disturbing is the industry’s answer to “what types of income investments should you own in your portfolio?” In today’s industry, many advisors seem to orient clients away from portfolios of individual securities and toward cookie cutter portfolios, many of which contain collections of mutual funds and exchange-traded funds (ETFs). Because of this, the solution offered to investors for income often seems to be just traditional bond mutual funds and ETFs.
There is an assumption, which we think is faulty, that underpins this whole discussion – that to allocate a steadily increasing portion of your assets to these bond mutual funds and ETFs is the “safe” way to manage your portfolio against risk. We have many years in this business advising clients how to build durable financial plans which sustain them through their retirement (and to plan for their financial legacies after they’re gone). Through that experience we have come to believe that this conventional wisdom around income investing is just wrong.
In today’s newsletter, we are going to walk you through our thoughts of how we view income investing – quite a bit differently than what seems to be the conventional wisdom. We believe there is no “one size” answer to the question of how much fixed income to own in an individual portfolio.
What really chafes at me in the income investing discourse is the widespread view that to invest in bond funds is somehow the “safe” way to invest. In analyzing the security performance over the last five years, especially, I have come to the conclusion that calling bond funds “safe” is not a conclusion based in actual fact. To bolster my view, I will take a look at both the returns and volatility profiles of bond funds over the past five years in order to answer the question that has been banging around in my head recently – “Are so-called ‘Safe’ assets really safe?”
Once I state this case, I will suggest areas of the market that present interesting alternatives to the cookie cutter approach currently most favored by our industry.
Since the last time we published in February 2024, we have seen significant changes in rates of return for fixed vehicles (see chart to the right). As we told you often in this space, we expected rates of return in short dated fixed assets like CDs to fall, so locking in fixed assets at higher rates in early 2024 was definitely the right move, in retrospect. We’ve seen something of a mixed bag however, with long rates like the 10-year US Treasury rate, rising steadily over the last few months.

Notably we see much lower rates in CDs and annuities. If you have maturing CDs (or perhaps iBonds that once paid 9% and now pay closer to 3%), we would love to have a conversation with you to discuss a best way forward to reallocate those funds, whether it be in income securities or elsewhere.
Head to our website and sign up for our mailing list, so you can receive our weekly updates in your inbox every Saturday morning. If you are starting to think about building and/or preserving your family’s fortune, we think this is a great place to begin setting your mindset toward growing your assets in the most efficient way possible.
With that all being said, let’s get into it!
A Focused Review of 2024 – Too High, Too Fast?
If you’re reading this newsletter, it’s likely that you’ve consumed plenty of “2024 in review” content. Rather than give you an exhaustive review of last year’s investing environment, we want to answer a question that we have been hearing a lot from clients. Since we have seen very strong market returns over the last 2 years, a number of investors seem to be concerned that we must be “due” for a correction.
There are some psychological factors at play behind this question, we have come to believe. Sometimes we can’t believe our good fortune in life, so we wait for the other shoe to drop when we experience strong investment returns. While this is all too human, I wanted to give you my two cents, with three reasons why we shouldn’t necessarily expect a market pullback just because returns were strong in 2023 and 2024:
(1) The Average Length of Bull Markets
We think context is important in answering the above question that we persistently receive when times are good in the markets. I understand that investors with limited experience may think that “what goes up, must come down”. Fortunately, over the last 75 years in US markets, which I would consider modern market history, bull markets tend to last a relatively long time. According to Forbes, the average S&P 500 bull market since 1949 has lasted 273 weeks (roughly 5.25 years), returning an average of 188%. If this is an average bull market, we likely have a lot of time to go before it runs out of steam.
Past results are no indicator of future performance. However, we think that market themes that have investors excited, including Artificial Intelligence (AI), digital transformation, cybersecurity, along with the nascent rally in financial stocks, all are reasons that this current bull market has a chance to continue raging over the coming years.
(2) The Lopsided Nature of the Market Rally
Over the past few years, you may have heard about the primacy of the Magnificent 7. These stocks have accounted for an outsized percentage of market gains in recent years, generating more than half of the S&P 500 return in 2024. An increasing portion of the market indexes is made up of these stocks, increasing from 21.9% in 2020 to 30.6% in 2024.
We think that many of these mega cap stocks continue to show promise in the future. With that said, as stock pickers, we think this could result in great opportunity for the other 493 stocks of the S&P 500. Take a look on the next page at the 2023 and 2024 returns in the market cap weighted S&P 500 (blue – 55.09%) vs the Invesco S&P 500 Equal Weight ETF (RSP – red 22.94%). This is also clear as we assess the two-year performance of the market weighted Invesco QQQ Trust (QQQ; blue -- 91.66%) vs. the Direxion NASDAQ-100 Equal Weighted Index Shares (QQQE; red -- 39.61%)
You will notice a visual representation of the observation I just made above -- that the largest stocks drove return throughout the first two years of the current bull market.
We acknowledge that there may be business reasons for this phenomenon. Conversely, we think that a disproportionate amount of investment has migrated to the largest stocks in the market. In our view, this creates great opportunity for future outperformance for stocks just below this higher echelon. We specifically like looking for stocks in the $20-150 billion market cap range. These are companies on the come up, with potential to become the next mega caps. We started following and investing in Nvidia (NVDA) when it was in this range. More recently, the best performing stock of 2024, AppLovin Corporation (APP), recently made an 8-for-1 move to move to the top echelon of the range we are referencing.
All of this is to say that we think there is additional opportunity in the market just below the mega cap level, despite the fact that the market at the overall index level has been so hot in recent years.

(3) A Quick Reminder Not to Mix Politics and Investing
We have just come through an emotional and hard-fought Presidential Election and now an inauguration. Understandably, some investors are nervous about the changes that are coming. We are monitoring any developments that may lead to higher inflation through expansionary fiscal policy or impacts from proposed tariff policy. We do want to help assuage any concerns related to a new Administration by reminding you that US markets tend to do quite well regardless of what party is in the White House.
Performance of “Safe” Investments post-Covid
At face value, there is a logic behind shifting funds from risk assets like stocks to assets more perceived as “safe”. In retirement investors have an expectation of lower volatility in a portfolio heavier in fixed vehicles. I can see the rationality in that sort of a strategic shift if we could safely assume that bond funds are low volatility vehicles.
Along the same lines, investors in retirement are looking for predictable and stable cash flows from their fixed investments, so that they can align investment income with future cash needs to pay bills in retirement.
In our view, the worst of all worlds is to place an investment we consider “safe” into the portfolio, only for that investment to lose money, when it was intended to provide buoyancy to the portfolio. The way that the “add fixed to your portfolio at all costs” managers talk about these investments, it’s as if they will never lose value.

Unfortunately, in practice and in recent memory, this has not been the case. Take a look at the chart above (Source: FactSet), which charts the course of three heavily owned fixed instruments: iShares 20+ Year Treasury Bond ETF (TLT; blue), an ETF that tracks the performance of long-term US government bonds, iShares Core U.S. Aggregate Bond ETF (AGG; green), and ETF that gives exposure to Investment Grade US corporate bonds, and Vanguard Total Bond Market Idx Instl Sel (VTBSX; orange), a mutual fund that holds both government and corporate debt.
As you can see from the chart above, each of these three widely-held fixed income instruments has lost value over the last five years. In a time in which stocks have delivered an average total return north of 14%, these “safe” investments have persistently generated losses on the position sheets of their investors. While we don’t think this means that investors shouldn’t hold fixed instruments (far from it), empirical data tells us that these sorts of instruments aren’t as “safe” as one might expect.
And why is that? When an investor shifts funds from stocks, for example, to bonds, that investor is trading one type of risk for another. When an investor purchases a bond fund, there is an assumption of what’s called “interest rate risk”. This term has a technical and academic definition, but can be boiled down to this simple principle: when bond rates rise, bond prices fall. This can be made clear as we chart the path of the US 10-Year Treasury bond rate (a proxy for overall interest rates in the economy; red line) vs. the TLT (mentioned above; blue line). As you can see, as rates have risen, the TLT has fallen precipitously:

My interpretation of this is simple. When determining the correct mix of stocks vs bonds in a given investor’s portfolio, we would argue that one must consider the interest rate environment. A simple “60% stocks/40% bonds” portfolio or an age-based rule would not be the best possible option in a rising interest rate environment.
Furthermore, there is the question of whether one should use bond funds at all to create a portfolio’s fixed income allocation. We covered this subject at length in our YouTube video entitled “Fundamentals of Investing: Individual Bonds vs Bond Funds”. Two major conclusions about individual bonds that we discuss in this video are:
1. Bond funds are highly sensitive to rate changes (as seen above). Bond funds purchased during the low-rate environment of 2008-2020 are unlikely ever to recover the prices paid by investors in those days. Conversely, individual bonds purchased in those low-rate days will pay investors their money back at maturity date. This means that regardless of the direction of interest rates, an investor will recover his or her principal when the bond matures, as long as there is no default.
2. By contract, individual bonds pay a fixed interest payment. Contrast that with bond funds, where the periodic interest payment can change over time. Bond funds are not truly predictable in this sense.
We want to add something to raise the stakes here. Those of you who have money in workplace funds (401(k), 403(b), 457, and the like) more than likely have money in bond funds. Beyond that, those of you using advisors may or may not have bond funds or ETFs in your portfolios. With that in mind, we would urge you to take a closer look at what you own, because these bond funds may be dragging down your overall return. This may be the reason that, as you review your portfolio returns over the last two years, that you may be lagging the overall market. If you are in one or both of these two boats, please get in touch with me (using the contact information below) and I would be happy to review your portfolio with you at no cost and no obligation.
All of this is to say that we dispute the ideas that investing in bond funds is necessarily the “safe” route for aging investors looking for income. A custom portfolio of income investments (bonds, high-dividend paying stocks like MLPs, REITs, and BDCs) could be more suitable, depending on an investor’s individual situation.
Alternatives to Bond Funds
If you accept our premise that the prevailing wisdom around income investing is wrong, you may be left frustrated, thinking that the most obvious and available tool for bringing balance and income to a portfolio is lacking. We wanted to suggest three possible alternative options for you that may or may not be suitable for your situation. If you are unsure, please contact your advisor or get in touch with Left Brain at (630) 547-3316 or briand@leftbrainwm.com and we would be happy to walk you through these investment options.
(1) Individual Bonds
When we purchase fixed income instruments for clients, it is for one main reason – their payments are FIXED. If you take a look at any bond mutual funds in your portfolio, you will notice that not only the interest payments, but also the price of the funds, fluctuate over time. What we are trying to do for income clients is to develop a stream of income that is predictable. When we purchase an individual bond and hold it to maturity, we know that as long as the company remains solvent and up to date on its bond payments, we will receive our original investment back at a date certain.
Let’s contrast that with an investor purchase of widely held iShares Core U.S. Aggregate Bond ETF (AGG). Below you will see a chart detailing the price of this instrument over the last 20 years. Between 2010 and 2022, interest rates were at historic lows, culminating in the major dip during the COVID period. Were you to have purchased this ETF between 2010 and 2022, you will almost assuredly take a loss when liquidating this position. In contrast, provided that you don’t purchase individual bonds at a price above the maturity value of 100, you can avoid taking a similar loss when you ultimately need the principal. Funds like AGG are forced to purchase bonds regardless of their market prices as fund flows come in, which creates situations like the one you can see between 2019-2022. On the other hand, if an investor’s fixed income portfolio is managed actively, she can avoid purchasing bonds at times of low interest rates. The conclusion: blindly purchasing bonds in low-interest rate environments can lead to significant losses of principal.

We prefer individual bonds for clients looking to secure income. One such bond that we like is the Bath and Body Works (BBWI) 2037 bond with a 7.6% annual coupon payment to holders. This bond can currently be purchased at a price slightly above maturity value. In our view, the annual income more than makes up for this slight premium paid.
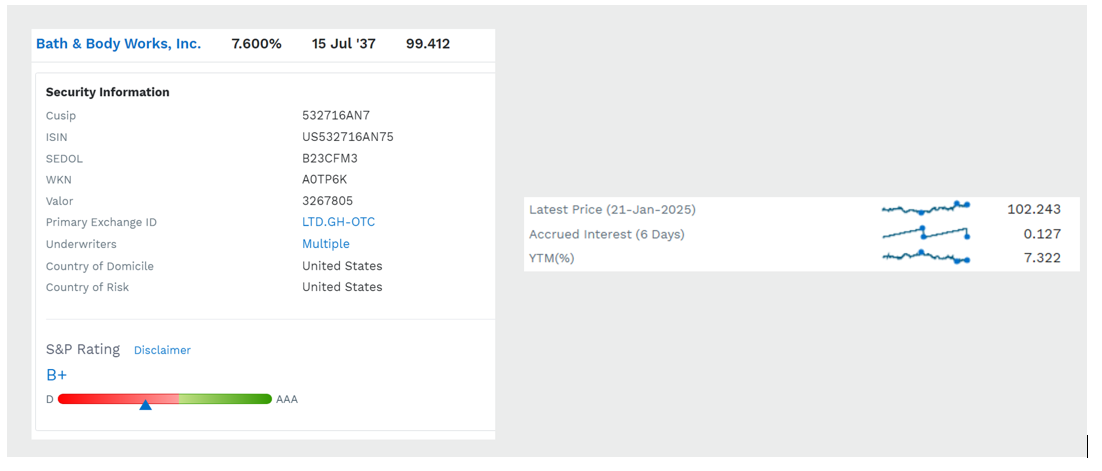
In charting out the overall cash flows related to this bond, which we have done in house, one notes that an investor would receive a total payout over 12 years of $19,880, representing a nearly 100% return in 12 years on an initial investment of $10,224. Often, we hear folks say that individual bonds are boring and don’t generate much return. That couldn’t be further from the truth in this case. The predictability of the cash flows, along with the annual return in excess of 7%, compare favorably to an instrument like AGG, which currently offers an income yield of 3.74% at the current trading price.
(2) Conventional Growth Stocks
When we build income portfolios at Left Brain, we tend to look at things differently than what you’d expect the conventional wisdom explained above. Conventional wisdom says to purchase a percentage of bonds in your portfolio equal to that of your age. The thinking behind that is that bonds (and bond funds, by proxy) are “safer” instruments than bonds. “Safer” is often used as a shorthand for “lower volatility”. In other words, many investors and advisors are operating under the assumption that bonds are much less volatile instruments than stocks. Volatility is often used as a proxy for measuring risk of a given financial instrument.
We thought we would put this theory to the test by plotting a measure of bond volatility, the ICE BofAML MOVE Index (^MOVE - blue) vs. the most widely followed measure of stock volatility CBOE Volatility Index (^VIX - red). Below you will see a chart of the two measures plotted against one another over the last 20 years:

As you can see, there is no discernable pattern showing that stock volatility is persistently higher than that of bonds. Further, as we look at things over the last five years, the overall bond market has carried a higher volatility rating than has the overall stock market! In no way would we argue that stocks are less volatile than bonds overall. However, the point we want to get across is that bonds don’t necessarily provide the hideaway from volatility that is often portrayed.
We take a different approach at Left Brain to the question of “how much fixed income should one own?” Instead of some rule-based approach like we’ve delineated above, we prefer a more needs-based method. Imagine a portfolio of $5 million with a client that has a cash need of $5,000 per month. The way we would consider building a portfolio in this case would be to allocate $1 million of that portfolio in fixed instruments at an average annual yield of 6%. In doing so, we have now solved for that cash need, regardless of how either the bond market or stock market performs. We then have the opportunity to invest the balance of the portfolio in any way that we see fit. In practice with the way we do things at Left Brain, that would likely include a health portion of growth stocks.
We think this approach is superior for clients who have an eye toward legacy planning. If we are managing to maximize a client’s legacy, then we must acknowledge the fact that the investment time horizon extends beyond the client’s lifetime. In recognizing this, we then realize that allocating a significant percentage of assets to a growth mandate makes more sense than does an age-based rule governing fixed income allocation, which would limit portfolio growth for legacy-minded clients of an advanced age.
All this is to say that one alternative to filling a portfolio mostly with bond funds may be in conventional stocks, despite what many in the financial industry would conventionally argue. Of course this is a hypothetical idea that isn’t suitable for all investors. If you’d like to discuss with us whether this novel approach makes sense for your legacy planning, please get in touch.
(3) Income Securities – Our Favorite Option for 2025
In 2022 and 2023, we were explicit in our view that corporate bonds presented an excellent opportunity, given the elevated interest rates at the time. We were routinely finding BB and BBB-rated bonds with yields between 7-9% available in time frames of 5-20 years. We thought this was a generational opportunity to lock in a portfolio of fixed income and solve for income needs for many years going forward.
Over the last year, however, many of the bonds we had seen previously yielding in the 7-9% range were now in the 5-7% range. This was not only due to the fact that the Federal Reserve embarked on a policy of cutting short-term rates, but also because economic conditions steadily improved. Some good opportunities were still out there, yes, but we went in search of pastures new for sources of income.
Enter what we call “income securities”. These are companies who pay the majority of their cash flow directly to investors in the form of dividends. Think of Real Estate Investment Trusts (REITs), Business Development Companies (BDCs), and Master-Limited Partnerships (MLPs).
Over the past year we have curated a list of roughly 30 stocks (our income model portfolio) that fit this mold. Since opportunities to lock in high yields in bonds are no longer as widespread, these securities have become central to our income strategy. Annual dividend yields on our list range anywhere from 6 to 14%. And since some of these companies pay qualified dividends, meaning that an investor may pay less than ordinary income on the dividend income from these stocks.
There are a couple cautionary statements we must make with respect to “income securities” relative to individual bonds. First, dividends are variable, meaning that companies are not required by contract to pay them to investors. We combat this risk by analyzing the dividend history of a given stock – we are looking for companies that have historically maintained or increased their dividends over a long period of time.
Note also that there is price risk in holding income securities, as these are stocks. As such they don’t have an intrinsic maturity value at a date certain. This means that we must consider that the risk of these instruments sits somewhere between bonds and growth stocks. They tend to be less volatile than growth stocks because investors price income securities based on the expected dividend payout, in comparison to growth stocks that usually don’t have this income component. In other words, there is some price risk involved here, but we think investors are rewarded for this risk in the form of generous and predictable cash flows.
I wanted to give you one example of an income stock that we have been purchasing over the past year, not only for income investors, but also for more aggressive investors. We like the predictable income involved here for investors of most risk appetites and time horizons. That security is Ares Capital Corporation (ARCC). Ares is a business development company (BDC) and is one of the largest direct lenders in the US. Most of their deals are private credit financing, with concentration in middle market lending in a variety of industries. The terms tend to be quite favorable to Ares and most of their lending occurs in the top echelons of the capital structure – revolver, first lien, second lien, etc. This is just industry jargon meaning that if a portfolio company in which ARCC is invested were to go bankrupt, Ares would be among the first creditors in line to recover their investment.
Ares takes advantage of the fact that the number of banks in the US is decreasing and the fact that regulatory requirements are making it challenging for conventional banks to persist in certain types of lending. This dynamic creates an unserved need for lending that ARCC has had some hand in filling in the marketplace. Since inception in 2004, the company has generated an internal rate of return on its investments of roughly 13%. This long track record, along with a history of steadily increasing dividends since the Global Financial Crisis of 2008-2009, gives us confidence that the dividend yield of 8.21% based on today’s market price is sustainable. Note also that ARCC pays qualified dividends, so there are some potential tax benefits for income investors here.
Over ARCC’s 20-year history, total investor returns have been comparable to that of the S&P 500, with the added benefit of the predictable dividend income. Over the past five years, ARCC has mirrored the total return of the broader market average, with most of the return coming from dividend income:

Takeaways
There was a lot to cover, as we briefly looked back at 2024 and shift our gaze to 2025 and beyond. Despite the strong performance of investment markets in 2023 and 2024, we still see many opportunities for strong returns in the coming years, as the market continues to be in bull market conditions. As we look at individual businesses, as well as the history of bull markets, we are confidently putting money to work for clients in this market. We understand that some investors have reservations, both given the past years of outperformance and the changing political landscape, but we remain optimistic.
As we look forward and determine investment strategies for clients, we are continuing to question the conventional wisdom -- that so-called “safer” assets like bond funds really are less volatile than the areas of the market where we concentrate our intention -- namely growth stocks, individual bonds, and income securities. Empirical data that we covered above suggests to us that conventional wisdom fails to describe the investment reality in which we live.
We think investors who have suffered with dismal returns in bond funds over the past 5 years should take a deeper look at their investment statements to determine why it is that their portfolios have been lagging the stock market, which has returned nearly 15% annually over the last 5 years.
For those of you not currently working with Left Brain as your advisor, we think now would be a great time to discuss how the Left Brain way of thinking (and investing) could potentially improve the strength of your plan to build your family’s wealth.
Please contact me directly at (630) 547-3316 or briand@leftbrainwm.com, or schedule time directly on my calendar if you want to engage a professional money manager like Left Brain to help you secure your retirement with an actively managed portfolio. We can offer either income opportunities like the ones mentioned here or growth stocks that we think could be strong performers in the long run.
For those of you who are clients, thank you for your continued trust and support and we will continue looking for opportunities like the ones described here to help you secure your family fortune and build wealth for the long term.
Thanks again for your continued support of the Jarvis Newsletter. Look for Left Brain content on a number of different platforms (YouTube, podcast, newsletters) in 2025 and please follow us on LinkedIn and Instagram, where we will be upping our presence throughout the coming year!
DISCLAIMER: This report contains views and opinions which, by their very nature, are subject to uncertainty and involve inherent risks. Predictions or forecasts, described or implied, may prove to be wrong and are subject to change without notice. All expressions of opinion included herein are subject to change without notice. Predictions or forecasts described or implied are forward-looking statements based on certain assumptions which may prove to be wrong and/or other events which were not taken into account may occur. Any predictions, forecasts, outlooks, opinions, or assumptions should not be construed to be indicative of the actual events which will occur. Investing involves risk, including the possible loss of principal. The opinions and data in this report have been obtained from sources believed to be reliable; neither Left Brain nor its affiliates warrant the accuracy or completeness of such and accept no liability for any direct or consequential losses arising from its use. In addition, please note that Left Brain, including its principals, employees, agents, affiliates, and advisory clients, may have positions in one or more of the securities discussed in this communication. Please note that Left Brain, including its principals, employees, agents, affiliates, and advisory clients may take positions or effect transactions contrary to the views expressed in this communication based upon individual or firm circumstances. Any decision to effect transactions in the securities discussed within this communication should be balanced against the potential conflict of interest that Left Brain, its principals, employees, agents, affiliates, and advisory clients has by virtue of its investment in one or more of these securities.
Past performance is not indicative of future performance. The price of securities can and will fluctuate, and any individual security may become worthless. A high or favorable rating, rating outlook, gauge, or similar opinion is not indicative of future performance, and no user should rely on any such rating, rating outlook, gauge, or similar opinion to predict performance or potential for return. Future performance may not equal projected or forecasted performance or potential for return. All ratings and related analysis, as well as data, statistics, analysis, and opinions contained herein are solely statements of opinion and are not statements of fact or recommendations to purchase, hold, or sell any security or make any other investment decisions.
This report may contain “forward-looking” information that is not purely historical in nature. Such information may include, among other things, projections, and forecasts. There is no guarantee that any forecasts made will materialize. Reliance upon information herein is at the sole discretion of the reader.
THE REPORT IS PROVIDED ON AN "AS IS" AND "AS AVAILABLE" BASIS WITHOUT REPRESENTATION OR WARRANTY OF ANY KIND. Left brain Wealth Management DISCLAIMS ALL EXPRESS AND IMPLIED WARRANTIES WITH RESPECT TO THE REPORT, INCLUDING, BUT NOT LIMITED TO, ANY WARRANTIES OF ACCURACY, TIMELINESS, COMPLETENESS, MERCHANTABILITY OR FITNESS FOR A PARTICULAR PURPOSE OR USE.
The Report is current only as of the date set forth herein. Left Brain Wealth Management has no obligation to update the Report, or any material or content set forth herein.